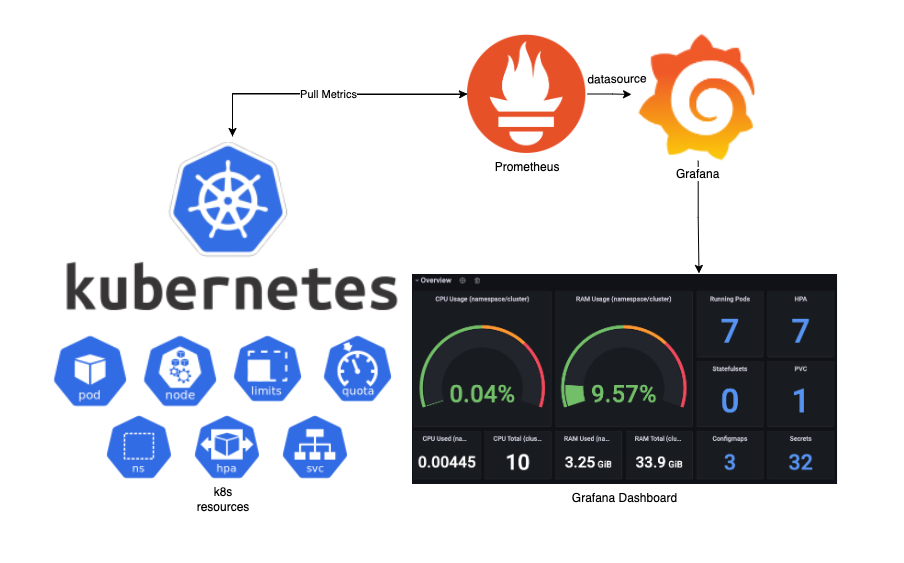
In this blog I would like to explain how-to install and configure monitoring in kubernetes with Prometheus (datacollector) and Grafana (dashboard).
This procedure is based on https://github.com/carlosedp/cluster-monitoring from Carlos Eduardo who created a complete integrated monitor solution for a kubernetes cluster.
Jeff Geerling made a video about it (see below). The procedure is the same which I will describe, with a few additions specified for our kubernetes build as described in this blog series..
The installation procedure start with the following:
Step 1:
Create two data folders in your kubedata folder on your nfs share called grafana and prometheus. These will be use to store your monitoring data and the config files.
Step 2:
Create a name space called monitoring with the following command:
kubectl create namespace monitoringStep 3:
Create the following two yaml files to create the persistent volumes. Please change the red values to your own.
The first one is called pv-grafana.yaml
apiVersion: v1
kind: PersistentVolume
metadata:
  name: grafana-pv-nfs
  namespace: monitoring
spec:
  storageClassName: ""
  capacity:
    storage: 20Gi
  accessModes:
    - ReadWriteOnce
  persistentVolumeReclaimPolicy: Retain
  nfs:
    server: xxx.xxx.xx.xxx            # IP number of your nfs server
    path: "/volume1/kubedata/grafana" # Path on your nfs server
    readOnly: false
The second one is called pv-prometheus.yaml
apiVersion: v1
kind: PersistentVolume
metadata:
  name: prometheus-pv-nfs
  namespace: monitoring
spec:
  storageClassName: ""
  capacity:
    storage: 2Gi
  accessModes:
    - ReadWriteOnce
  persistentVolumeReclaimPolicy: Retain
  nfs:
    server: xxx.xxx.xx.xxx               # IP number of your nfs server
    path: "/volume1/kubedata/prometheus" # Path on your nfs servers server

    readOnly: false
You can apply both files to your kubernetes cluster via the commands:
kubectl apply -f pv-grafana.yaml
kubectl apply -f pv-prometheus.yaml
Step 4:
After the persistent volumes have been created we will clone the github repository from Carlos Eduardo (https://github.com/carlosedp/cluster-monitoring ). The script below change your directory to homefolder, install the prerequisites and clone the repository.
#Install cluster monitoring grafana / prometheus raspberry piechart
cd ~
sudo apt-get update && sudo apt-get install -y build-essential golang git
git clone https://github.com/carlosedp/cluster-monitoring.git
cd cluster-monitoring
Step 5:
After the github repository has been cloned you need to make the following adjustments
to the vars.jsonnet file. You can edit the file with nano via the following command
Make the following (green) adjustments. Please change the red values to your own.
to the vars.jsonnet file. You can edit the file with nano via the following command
nano vars.jsonnetMake the following (green) adjustments. Please change the red values to your own.
{
  _config+:: {
    namespace: 'monitoring',
  },
  // Enable or disable additional modules
  modules: [
    {
      // After deployment, run the create_gmail_auth.sh script from scripts dir.
      name: 'smtpRelay',
      enabled: false,
      file: import 'modules/smtp_relay.jsonnet',
    },
    {
      name: 'armExporter',
      enabled: true,
      file: import 'modules/arm_exporter.jsonnet',
    },
    {
      name: 'upsExporter',
      enabled: false,
      file: import 'modules/ups_exporter.jsonnet',
    },
    {
      name: 'metallbExporter',
      enabled: true,
      file: import 'modules/metallb.jsonnet',
    },
    {
      name: 'nginxExporter',
      enabled: true,
      file: import 'modules/nginx.jsonnet',
    },
    {
      name: 'traefikExporter',
      enabled: false,
      file: import 'modules/traefik.jsonnet',
    },
    {
      name: 'elasticExporter',
      enabled: false,
      file: import 'modules/elasticsearch_exporter.jsonnet',
    },
    {
      name: 'speedtestExporter',
      enabled: false,
      file: import 'modules/speedtest_exporter.jsonnet',
    },
  ],

  k3s: {
    enabled: false,
    master_ip: ['192.168.1.15'],
  },

  // Domain suffix for the ingresses You can this to your own domain for example "mydomain.com"
  suffixDomain: '192.168.1.15.nip.io',
  // Additional domain suffixes for the ingresses.
  // For example suffixDomain could be an external one and this a local domain.
  additionalDomains: [],
  // If TLSingress is true, a self-signed HTTPS ingress with redirect will be created
  TLSingress: true,
  // If UseProvidedCerts is true, provided files will be used on created HTTPS ingresses.
  // Use a wildcard certificate for the domain like ex. "*.192.168.99.100.nip.io"
  UseProvidedCerts: false,
  TLSCertificate: importstr 'server.crt',
  TLSKey: importstr 'server.key',

  // Persistent volume configuration
  enablePersistence: {
    // Setting these to false, defaults to emptyDirs.
    prometheus: true,
    grafana: true,
    // If using a pre-created PV, fill in the names below. If blank, they will use the default StorageClass
    prometheusPV: 'prometheus-pv-nfs',
    grafanaPV: 'grafana-pv-nfs',
    // If required to use a specific storageClass, keep the PV names above blank and fill the storageClass name below.
    storageClass: '',
    // Define the PV sizes below
    prometheusSizePV: '2Gi',
    grafanaSizePV: '20Gi',
  },

  // Configuration for Prometheus deployment
  prometheus: {
    retention: '15d',
    scrapeInterval: '30s',
    scrapeTimeout: '30s',
  },
  grafana: {
    // Grafana "from" email. Fill in your e-mail reply address for grafana messages
    from_address: 'myemail@gmail.com',
    // Plugins to be installed at runtime.
    //Ex. plugins: ['grafana-piechart-panel', 'grafana-clock-panel'],
    plugins: [],
    //Ex. env: [ { name: 'http_proxy', value: 'host:8080' } ]
    env: []
  },
}
As you might have noticed you configure the modules you want to use for monitoring in this file. The configuration above is based on the modules I have described in my blogs, but you can ofcourse change them to you modules you use (for example traefik in stead of nginx )
Step 6:
After you have made your adjustments to the vars.jsonnet file, we can generate manifests files and deploy grafana, prometheus and alertmanager to our kubernetes cluster with the following commands.
make vendor
make
make deploy
When these have finished you can check the deployment in kubernetes via the command:
kubectl get all -n monitoring
Step 6:
To be able to access grafana, prometheus and alertmanager web interfaces we will create 3 ingress yaml files. Please change the red values to your own.
apiVersion: networking.k8s.io/v1
kind: Ingress
metadata:
  name: alertmanager-main
  namespace: monitoring
  annotations:
    kubernetes.io/ingress.class: "nginx"
#    nginx.ingress.kubernetes.io/backend-protocol: "HTTPS"
    cert-manager.io/cluster-issuer: "letsencrypt-prod"
#    nginx.ingress.kubernetes.io/app-root:
spec:
  rules:
  - host: alertmanager.mydomain.com
    http:
      paths:
      - path: /
        pathType: Prefix  # pathType no longer has a default value in v1; "Exact", "Prefix", or "ImplementationSpecific" must be specified
        backend:
          service:
            name: alertmanager-main
            port:
              name: web
  tls:
  - hosts:
    - alertmanager.mydomain.com
    secretName: alertmanager.mydomain.com-tls
The second one is called ingress-grafana.yaml
apiVersion: networking.k8s.io/v1
kind: Ingress
metadata:
  name: grafana
  namespace: monitoring
  annotations:
    kubernetes.io/ingress.class: "nginx"
#    nginx.ingress.kubernetes.io/backend-protocol: "HTTPS"
    cert-manager.io/cluster-issuer: "letsencrypt-prod"
#    nginx.ingress.kubernetes.io/app-root:
spec:
  rules:
  - host: grafana.mydomain.com
    http:
      paths:
      - path: /
        pathType: Prefix
        backend:
          service:
            name: grafana
            port:
              name: http

  tls:
  - hosts:
    - grafana.mydomain.com
    secretName: grafana.mydomain.com-tls
The third and last one is called ingress-prometheus.yaml
apiVersion: networking.k8s.io/v1
kind: Ingress
metadata:
  name: prometheus-k8s
  namespace: monitoring
  annotations:
    kubernetes.io/ingress.class: "nginx"
#    nginx.ingress.kubernetes.io/backend-protocol: "HTTPS"
    cert-manager.io/cluster-issuer: "letsencrypt-prod"
#    nginx.ingress.kubernetes.io/app-root:
spec:
  rules:
  - host: prometheus.mydomain.com
    http:
      paths:
      - path: /
        pathType: Prefix  # pathType no longer has a default value in v1; "Exact", "Prefix", or "ImplementationSpecific" must be specified
        backend:
          service:
            name: prometheus-k8s
            port:
              name: web
  tls:
  - hosts:
    - prometheus.mydomain.com
    secretName: prometheus.mydomain.com-tls
After the files have been created, they can be applied to kubernetes via the commands:
kubectl apply -f ingress-alertmanager.yaml
kubectl apply -f ingress-grafana.yaml
kubectl apply -f ingress-prometheus.yaml
Step 7:
If everything went ok you should be able to open the grafana dashboard via a browers to the address configured in the ingress file. In the example this is https://grafana.mydomain.com. The default username and password is "admin".

You can also open the frontend websites for alertmanager and promtheus.
In the video from Jeff Geerling (at the beginning of this post) he will show some options of this grafana implementation with kubernetes monitoring. There are alreay some dashboard for kubernetes included. To learn the basics of grafana please visit https://grafana.com/docs/grafana/latest/getting-started/

I hope you found this blog useful. I you have any questions do not hesitate to leave a comment below.
You can also find the example on my Github. See link
You can also find the example on my Github. See link
PS: You can remove the configuration by running these commands:
cd ~\cluster-monitoring
make teardown
Comments
Post a Comment